Crude Oil
Date 15.07.2015 6.15
PM
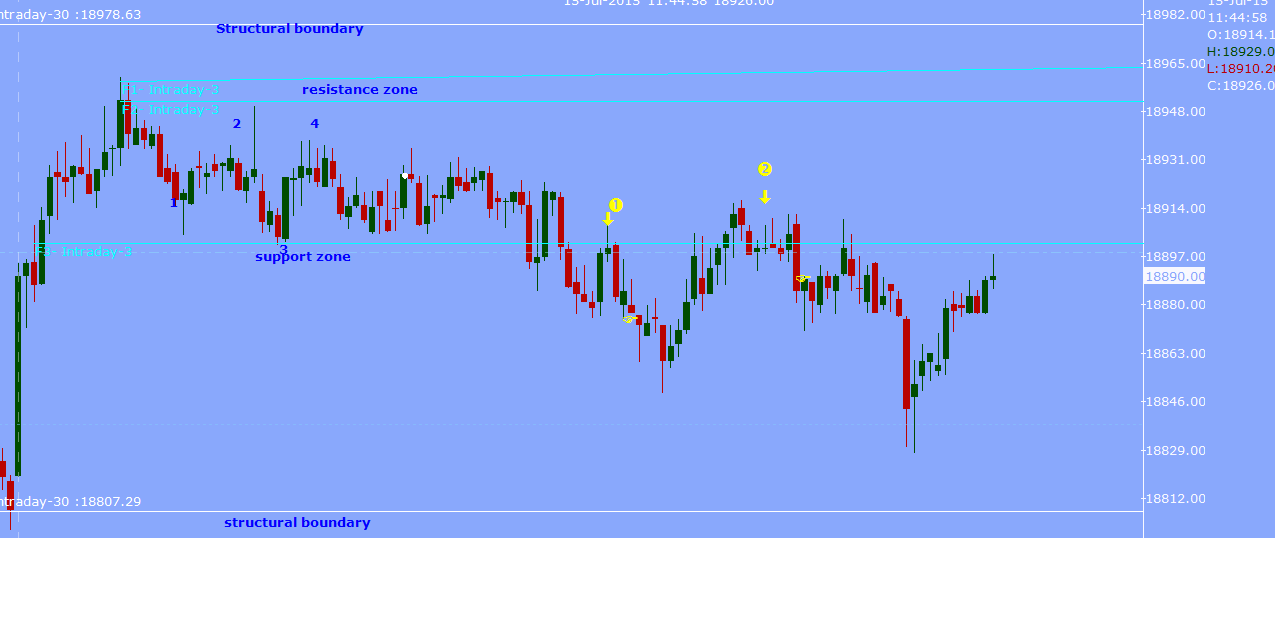
Trend is down .
Now confirm sideways trend, after plotting 4 pivot point .
draw S/R zones .
Bear are in strength and bull are weak in comparison in
sideways zone.
And price is approached to boundary line in strength , I think
boundary will break , now I look after breaking of boundary willb have strength
in present trend in pullback .
6.50 pm Price break a support zone on strength , now next
step for , price accepted in zone ???
. wait for BOF/BPB entry.
Trade 1:-PULLBACK
Place Limit entry order @ 3330. And stop is 3334
Now price is not break LWP , I am worried about it but faith
on my strategy . time 7.04 pm
Exit 3313
Time 7.15 trend sideways >>> down .
Time :-7.28 pm
Trade 2:- PULLBACK
ENTRY (confidance on TTF pinbar )
Place 3324 limit order entry ….Entry fill now SL is 3327 .
and LWP is 3318 .
Entry with the help of LTF …and LWP triggerd now wait for
tgt.
Scratch trade @ 3322
TIME :- 7.51
CRUDE OIL INVENTORY :- DON’T TRADE BEFORE 15 MIN. AND AFTER
15 MIN. OF CRUDE OIL INVENTORY ..7.45 TO 8.15 PM NO trade .
Time 7.55 price turned to sideways .
After inventory price is rejected from lower side , now I say
Bull are powerful .mkt hands in bull , looking for BULLISH setup in this zone .
Structural boundary

Trading Time Frame

Lower Time Frame

Thank you


