Tuesday, September 8, 2015

0.8.09.2015 Banknifty

Banknifty

My main focus to reduce no. of trades per day .

today is too more trade . its bad for me .


total no. trades :-10
No. of win trades -5
No . of lose trade -4
No. of  scratch trades -1


thank you

Friday, September 4, 2015

04-09-2015 Crude OIL

Hello ,

Today is frist day of journal after discuss with jagdeeshji .

Today take two trades , One with Target and one with SL .


Higher Time Frame Chart


Trading Time Frame Chart


Lower Time Frame Chart


Trade Explanation :-  First Trade BOF of previous Move with PB entry . Nice timing of trade and exit also .

 Second trade :- FTC of Previous swing Entry was too early and actual focus on LTF and thats mistake . and Hit SL .

Thank you
                                    

04-09-2015

Banknifty

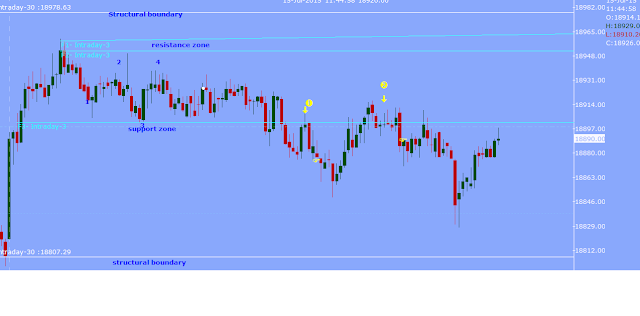
I am trading Banknifty future . My HTF is 30 min. ,TTF is 3 min. and LTF is 1 min.
This method is completely jagdeeshji method , i am just follower of it .


Today take three trades . all trades take in early morning . rest of the day only sit front of screen .


Higher Time Frame Chart

 Trading Time Frame Chart

Lower Time Frame Chart


Trade Explanation

1 ) PULLBACK trade :- Market open and drag down very fast , i am looking for short entry and it gave me nice set up .
my exit is very early and whole day i regreat for it .

2) PB :- trend down and market halt some time here ,when second time push fail , i will enter in it.

3) Conter trend :- PB :- market is not intrested to go down , i will look for CT trade , i enter but only few bucks SL. mkt hit my stop and move toword my bias , its bad luck .

After that , one BOF trade seen but i was not react timely on it and miss that trade .

Thank you .

Tuesday, July 28, 2015

28-07-2015 Banknifty

Today is very nice movement

Trading Time Frame Chart


Lower Time Frame Chart


Thank you

Monday, July 27, 2015

27-07-2015 Banknifty

Today is TYPE 1 day. Trend day , whole day price not give any chance for bull,bear are strong .

One side down movement .price not give any strong pullback .

Trading Time Frame Chart


Lower Time Frame Chart


Thank you 

Friday, July 24, 2015

24.07.2015 Banknifty

Banknifty open around previous days range,and it move around first 2.5 hour in that range .
price moved around down range and end there.


Trading Time Frame Chart


Lower Time Frame Chart


Thank you 

Thursday, July 23, 2015

23.07.2015 Banknifty

Today banknifty open near previous day close . Gave BOF of PPDH /PPDC.
price approches very nicely , only we want to follow his signals.
Price give nice pullback entry at second session.

Trading Time frame chart


Lower Time Frame Chart


Thank you 

Wednesday, July 22, 2015

22-07-2015

Crude oil
Inventory data :- inventory data almost decide next move of crude every Wednesday.
today price gave nice     BOF of days high and days low also.


Trading Time Frame Chart


Lower Time Frame Chart


Thank you 

22.07.2015 Banknifty

Today is TYPE 1 Day . Bull are strong and not give any single  chance to bear.
Dont dought on trend Whenever price have strength Or no weakness on opposite side, just  follow it .
Price approaches to structural boundary with overlaping candles. they break it and gave Pullback twice (   i confuse at second pullback to think about trend change ).
after break of structural boundary price has no decide where to go almost 2 hours.
(have lot of Patience , to wait for opportunity    OR right time to enter) 

Trading Time Frame Chart


Lower Time Frame Chart


Thank you

Tuesday, July 21, 2015

21.07.2015 Crude oil

Price approaching to structural boundary have no strength , but bear have also no strength , price break boundary successfully , but on Pullback there is confusion to bias either BOF or BPB, finally price gave nice move on BPB.
 Another one Pullback entry on price reverse on downside .

Lession :- dont hurry to  trade ,keeep in mind .Missed money is always better than lost money.


Trading Time Frame Chart


Lower Trading Time Frame


Thanks


BANKNIFTY 21.07.2015

Banknifty open around PDC . give nice BOF of PDH.
Today is TREND 1 type day .
All day down trend continue and price make lower low up to end of the day.
Price gave nice PULLBACK set up ,we want only wait for set up and take trade on it .


Trading Time Frame Chart


Lower Time Frame Chart


Thank you 

Monday, July 20, 2015

20.07.2015 Crude Oil


Keep eye on structural boundary . focus on Strenght and weakness of price . when price approch to SB.
Keep eye on also PDH,PDL,PDC and MSP also .there is always moment come.

Today in morning session on banknifty and evening session of crude oil gave nice Pullback entry . 
we just stay calm and feel the price action song we will get nice rhythm of it . i really happy today ,i recognize that price in advance . 

Trading Time Frame Chart 


Lower Time Frame Chart 


Thank you

20.07.2015 Banknifty

Hello ,

Banknifty open to Previous day close and slide to down side .
Give nice PullBack entry twice on TTF and LTF also .
just feel the Price action flow and sing it ,

Trading Time frame


Lower Time Frame


Price move both side and give both side entry at right place  .
i remind my previous lession , dont think to opposite side of trend , just follow it


Thank you

Friday, July 17, 2015

17.07.2015 Crude Oil

Today i am not attained crude oil session , below chart is only hindsight analysis , and marking points.

                                                        Trading Time Frame Chart

Lower Time Frame Chart 


17.07.2015 Banknifty

Hello , Today i have focused on only TTF , avoid to watch Lower Time Frame chart .

Market give two set up one is morning BOF of PDC/PDH , and another one is last hour Pullback for short entry.


Lession :- don’t think to ,much about TRADE every time . give some time for analyse price and only think about TRADE , IF and ONLY IF price Fullfill all condition of ENTRY. Keep this in MIND , before enter in trade,

Thank you 

Thursday, July 16, 2015

Multiple TVP Breaks

Hello ,
Yesterday i have got one of price action , which breaks TVP both time in multiple time , and faces some confusion in front of chart .
i am here posting this problem , and ask solution to all you , specially jagdeeshji and all seniors .
how to react on it , in front of screen , whenever that type of situation we face .
please refer below chart one by one.

Example of multiple TVP breaks
Date -15.07.2015
Name :- Crude Oil
Time Frame-3 min. its TTF.

Chart 1

we are in downtrend


Chart 2 :-
Price breaks Latest TVP and price turn to UPTREND. Now we are in uptrend.

Price approaching to structural boundary with strength .
Now we expect two scenario.
1) BPB
2) BOF


Chart -3

Its BOF .
Price give pullback and make latest TVP.
we are in downtrend now .


Chart -4

My problem start from here .
Look at chart what a surprise move .
price breaks latest TVP..and move upside . (now i am confusing ........its UPTREND now ....)


In hindsight  only ....Price give TEST set up to structural boundary and move down.
make Latest TVP.


Chart 5

Price again Break latest TVP .....( i am again cofusing about TVP here ) ...now again think about trend change .
look at chart ...

In hindsight analysis , its BULL TRAP.

These is whole things , i have faced yesterday .

i want guidance on it . how to face situation like this .
Lot of questions in my mind
 Is anything wrong with to  plot TVP. ??
we can change TVP according to situation ??
Or give some room to price to move in between them ?? totally confuse ....and have idea to post it here and ask solution on it .
i hope you understand what is exactly i want to ask.

your suggestion , guidance , comments are welcome. I just start to skill deveploment.
Thank you

16.07.2015 Crude Oil

Date -16.07.2015   TIME- 5.15 PM
CRUDE OIL  
Trend is down now  and looking for pullback set up .
In last two hour change trend change down to up and again up to down.
Candle size also big ,volatility also increase .


In today market move in both direction like roller-coster. i.e. -DOWN >>UP>>DOWN>>UP.

Trading Time Frame Chart
 Lower Time Frame Chart


Thank you

16-07-2015 BankNifty


BANKNIFTY
DATE:- 16-07-2015

Market open within range BIAS is sideways.
Now I am looking for BOF of PDH .Now price apporching with strength on Structural boundary .
Price Break boundary and trend start with UPTREND.
whole day mkt in trend . 
ITS type 1 day .(TREND DAY).


Trading Time Frame Chart

Lower Time Frame Chart


Thank you

Wednesday, July 15, 2015

15.07.2015 Crude Oil

Crude Oil
Date 15.07.2015  6.15 PM
Trend is down .
Now confirm sideways trend, after plotting 4 pivot point . draw S/R zones .
Bear are in strength and bull are weak in comparison in sideways zone.
And price is approached to boundary line in strength , I think boundary will break , now I look after breaking of boundary willb have strength in present trend in pullback .
6.50 pm Price break a support zone on strength , now next step for , price accepted in zone ???
. wait for BOF/BPB entry.

Trade 1:-PULLBACK
Place Limit entry order @ 3330. And stop is 3334
Now price is not break LWP , I am worried about it but faith on my strategy . time 7.04 pm
Exit 3313
Time 7.15 trend sideways >>> down .
Time :-7.28 pm

 Trade 2:- PULLBACK ENTRY  (confidance on TTF pinbar )
Place 3324 limit order entry ….Entry fill now SL is 3327 . and LWP is 3318 .
Entry with the help of LTF …and LWP triggerd now wait for tgt.
Scratch trade @ 3322
TIME :- 7.51

CRUDE OIL INVENTORY :- DON’T TRADE BEFORE 15 MIN. AND AFTER 15 MIN. OF CRUDE OIL INVENTORY ..7.45 TO 8.15 PM NO trade .

Time 7.55 price turned to sideways .
After inventory price is rejected from lower side , now I say Bull are powerful .mkt hands in bull , looking for BULLISH setup in this zone .


Structural boundary

Trading Time Frame


Lower Time Frame


Thank you 

15.07.2015 BANKNIFTY


Date :-  15-07-2015
BANKNIFTY
Open near previous day close and move upword and stay there whole day . After pivot 4 confirm I confirm there is sideways movement and think to trade according to that .
Once break the range low , I look for pullback .

Trade :- 1 ) Pullback
Once pinbar confirmed in TTF took trade .exit trade when Pinbar high broken.

Trade :- 2) Price breaks Trend violation point
 (trend change to upside , price enter in previous S/R zone).
Not follow up seen in buying ..then I enter in trade.
(when I took trade that time I think its CPB , but I look now then I think its wrong its not CPB.)
Exit look at LTF chart whenever price not going to trend direction .
 

Structural Boundaries


Trading Time Frame chart


Lower Time Frame Chart


Lession :- Before  define and reconise  SETUP don’t look for trade . In second trade will get second entry for trade , I want to wait for that with LIMIT entry.


Today is first day for trading with Discretionary trading method with the help of Jagdeeshji and other follower , i request to all please guide me whenever i make mistake and please support me.

Thank you