Friday, January 4, 2019

Crude Oil 04-01-2019

Took trade out of barbed wire , with SL is high of breakdown candle with first trouble are is next msp is around 20 point from entry , but i hope to crack this trouble area but not and scratch trade 10 point profit only

Fail to recognize FTA is good flip point to enter new trade and miss this opportunity.:(  

Thursday, January 3, 2019

Crude Oil 03-01-2019

I am not update blog last 1 year , now again start to update with lots of improvement .
New year resolution to less scalping and only focus on price action and trading with pure chart base.
lets see

 Today traded crude oil

Price approach MSP and above it PDH there is double layer there .Price halt ample time there made BT and reverse . Range break and gave nice PB . I short there.

Saturday, September 23, 2017

Review of My Trades / articles

Hello Friends , I am just record my Trades & Strategy here.
Whatever the out come i will post time to time here , I am try to explain Strategy logic behind the trades.
Just simple ask questions our self before put our hard earn money in  stock market.

 1) Why I put my hard earn money on this stock ?
 2) Is this stock good for trading/Investment purpose ?
 3) What is the Strategy behind buy/sell /short sell of this stock ?
 4) What is Strategy ? Is this Strategy  suit me  ? Is it back tested ?
     How much success ratio of this strategy ?
     This strategy have positive expectancy ?
 5)What is  Time frame for my Investment /Trading ?
 6)How much  RISK  involved in this trade? How much Loss I bare if my stop-loss hit ?
       ( Trade without Stop-loss is suicide in stock market, Its my personal opinion )
 7) What is Money management ? How much capital  allocation per trade ?
     and after all
 8) How much Return i expect from this trade/ Investment?
 9) What is my exit Plan? Partial exit from my position , full exit, wait for target hit ,
        wait for stop-loss hit ,trailing stop-loss,exit around cost-to cost etc

Above all points Ask yourself Before taking trade
Rest all  things  depends on Market .Market is supreme ,just follow it.

1) TATA ELXSI
 http://chartindia.blogspot.in/2017/09/welcome-friends-almost-2-yr-back-i-stop.html

This stock give me more than 200 % return in call option.

2) UPL
http://chartindia.blogspot.in/2017/09/upl-do-or-die.html

This stock not perform as per my expectation , I exit my 2 lots of  840 CE option around 40 % profit and rest cost-to-cost.

3) RAYMOND
http://chartindia.blogspot.in/2017/09/pin-bar-low-risk-high-reward.html

I simply mention on this article ,Low risk -High reward ,Rest is history. Nobody dare to short on RAYMOND ,cause this stock traded on 52 week high, but I faith on my studies ,rest things market show us.
 Mostly I take position in OPTIONS these days , but  Raymond options are not liquid , then I take  only 2 lot buy of 880 Put option around 22-25 rs  & exit 34 & 46 respectively making almost 100 % return.
Short sell 3 lot of RAYMOND Future around 882 with  Stop-loss 908
     Covered 1 lot @ 834 ,another 821 & rest one lot hold


Saturday, September 16, 2017

PIN BAR - Low risk High reward

 Candlestick chart have many patterns.So today we will learn about Pin bar .(see below image)

If you See above image , you will get the idea why we call this shape/pattern Pin bar , because of  long tail & short head.

Pin bar have two types Bullish and Bearish.

1. Bullish :- Long tail of bar at lower side & head on upper side.

2. Bearish :- Long tail of bar on upper side & head on lower side


This bar have higher possibility of success and also cover the high risk reward.


Look at below charts,


  • Bullish Pin Bar Chart


  • Bearish Pin Bar Charts

chart 1


Chart 2


 We can use both the patterns in trade / investment successfully.

Live example of  Pin Bar  posted below . You can also track  live

Weekly Chart of  RAYMOND . 
Bearish Pin Bar


Benefit of Pin Bar :

  •  It is very simple to understand.
  •  No complicated indicators.
  • Easy to recognize structure. 
This is not only for example, I am also using this pattern for my trade .

Regards

Saturday, September 9, 2017

UPL - Do OR Die

Now a days, I am  focusing on option trading .Before enter  in to trade, In option you must have knowledge of time value,because time value help you to do a right trading .

As you aware option trading is very risky but if you work smartly nothing is hard.
Without risk there is no reward in stock market.


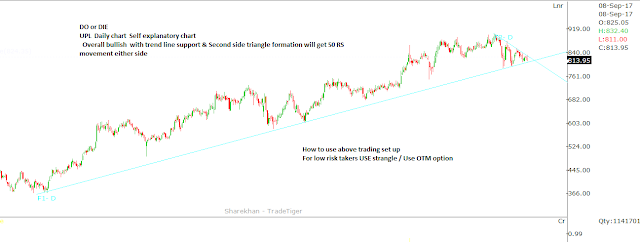
UPL Daily char

  See the above chart if you observe it is self explanatory. Long term trend-line support and triangle formation .  We can  expect movement at any side ,you must follow the  price action .

Saturday, September 2, 2017

SYNDICATE BANK

Long term investment bet.Support around 50-60 rs accumulate in between them with double in two years. Chart is self explanatory.


Friday, September 1, 2017

TATA ELXSI

Welcome friends , almost 2 yr back i stop to post chart .
Now i am more focus to trade in options .

Following chart of TATAELXSI.
Half hourly charts i post below. Making triangle looks picture are crystal clear.

Trading idea :- Buy TATAELXSI above 1660 with SL-1640 Tgt- OPEN
Option :- BUY TATAELXSI 1700 CE